r***@outlook.com
r***@outlook.com
  • 发布:2019-12-16 16:57
  • 更新:2019-12-17 16:20
  • 阅读:1849

echarts三维图表如何引用

分类:uni-app

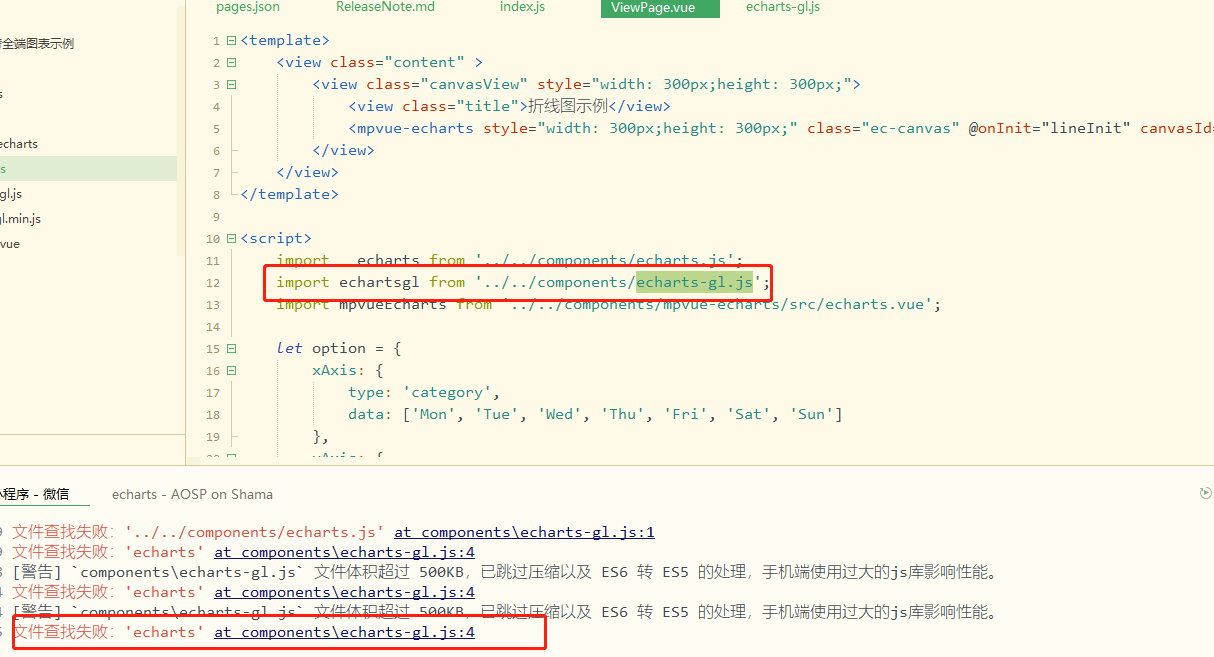
请问echarts的三维图表可以弄吗,我试了需要引用echarts-gl.js,但我引用后这个echarts-gl.js一直报错,提示找不到echarts,请问如何处理

2019-12-16 16:57 负责人:无 分享
已邀请:
登录异常

登录异常

<template>  
    <div class="hello">  
        <div ref="myChar" style="width: 600px;height: 400px;"></div>  
        <div ref="three" style="width: 600px;height: 400px;"></div>  
    </div>  
</template>  

<script>  
    import echarts from "echarts";  
    import echartsgl from "echarts-gl"  
    export default {  
        name: 'Three3d',  
        components: {  
            echarts,  
            echartsgl  
        },  
        data(){  
            return{  

            }  
        },  
        created() {  

            this.$nextTick(function(){  
                this.initChart();  
                this.initThree();  
            })  
        },  
        methods:{  
            initChart(){  
                // 基于准备好的dom,初始化echarts实例  
                var a = this.$refs.myChar;  
                if(a){  
                    console.log(a)  
                    var myChart = echarts.init(a);  
                    // 指定图表的配置项和数据  
                    var option = {  
                        title: {  
                            text: 'ECharts 入门示例'  
                        },  
                        tooltip: {},  
                        legend: {  
                            data: ['销量']  
                        },  
                        xAxis: {  
                            data: ["衬衫", "羊毛衫", "雪纺衫", "裤子", "高跟鞋", "袜子"]  
                        },  
                        yAxis: {},  
                        series: [{  
                            name: '销量',  
                            type: 'bar',  
                            data: [5, 20, 36, 10, 10, 20]  
                        }]  
                    };  

                    // 使用刚指定的配置项和数据显示图表。  
                    myChart.setOption(option);  
                }  
            },  
            initThree(){  
                var a = this.$refs.three;  
                if(a){  
                    var data = [];  
                    // Parametric curve  
                    for (var t = 0; t < 25; t += 0.001) {  
                        var x = (1 + 0.25 * Math.cos(75 * t)) * Math.cos(t);  
                        var y = (1 + 0.25 * Math.cos(75 * t)) * Math.sin(t);  
                        var z = t + 2.0 * Math.sin(75 * t);  
                        data.push([x, y, z]);  
                    }  
                    console.log(data.length);  
                    var myChart = echarts.init(a);  
                    var option = {  
                        tooltip: {},  
                        backgroundColor: '#fff',  
                        visualMap: {  
                            show: false,  
                            dimension: 2,  
                            min: 0,  
                            max: 30,  
                            inRange: {  
                                color: ['#313695', '#4575b4', '#74add1', '#abd9e9', '#e0f3f8', '#ffffbf', '#fee090', '#fdae61', '#f46d43', '#d73027', '#a50026']  
                            }  
                        },  
                        xAxis3D: {  
                            type: 'value'  
                        },  
                        yAxis3D: {  
                            type: 'value'  
                        },  
                        zAxis3D: {  
                            type: 'value'  
                        },  
                        grid3D: {  
                            viewControl: {  
                                projection: 'orthographic'  
                            }  
                        },  
                        series: [{  
                            type: 'line3D',  
                            data: data,  
                            lineStyle: {  
                                width: 4  
                            }  
                        }]  
                    };  
                    // 使用刚指定的配置项和数据显示图表。  
                    myChart.setOption(option);  
                }  
            }  
        }  

    }  
</script>  

<style>  
</style>  

不知道你为什么不能用,我是可以用的

该问题目前已经被锁定, 无法添加新回复