<template>
<view class="canvasView">
<!-- <mpvue-echarts class="ec-canvas" :echarts="echarts" canvasId="map" ref="mapChart" /> -->
<div ref="mapChart" id="main" style="width: 750upx; height:800upx; margin: 10px auto;"></div>
</view>
</template>
<script>
import * as echarts from 'echarts' 地图option:
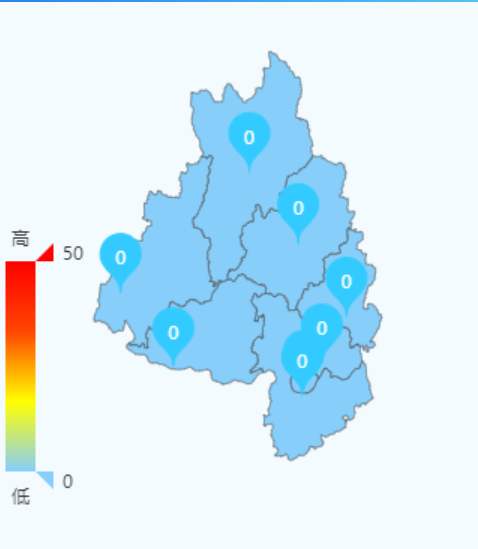
let option={
dataRange: {
min: 0, //颜色区间的最小值
max: 50, //颜色区间的最大值,和data中的最大值一致
x: "left",
y: "bottom",
text: ["高", "低"], // 文本,默认为数值文本
calculable: true,
inRange: {
//颜色区间
color: ["lightskyblue", "yellow", "orangered", "red"]
}
},
tooltip: {
trigger: 'item',
show: true,
formatter: function(params,ticket,callback) {
console.log('----------')
console.log(params);
console.log('----------')
return (
"地区:" +
params.data.name
);
}
},
series: [
{
type: "map",
map: "demo",
itemStyle: {
normal: { label: { show: true } },
emphasis: { label: { show: true } }
},
itemStyle: {
emphasis: {
shadowBlur: 10,
shadowOffsetX: 0,
shadowColor: 'rgba(0, 0, 0, 0.5)'
}
},
roam:true,
data: this.markdata,
markPoint: {
symbolSize: 45,
itemStyle: {
normal: {
borderColor: "#33CBFF",
color: "#33CBFF",
borderWidth: 1, // 标注边线线宽,单位px,默认为1
label: {
show: true
}
}
},
                  data: this.markdata,
                }
              }
            ]
          };


c***@sohu.com
遇到相同问题了,谢谢高手的答案。
2021-06-17 11:01
1***@qq.com
niubi
2022-09-21 16:42
8***@qq.com
牛逼,听我说谢谢你
2023-06-13 19:07
1***@qq.com
牛逼
2023-08-16 16:20
大臭鸡
大哥 你这答案有用 加了 这行就行了
2025-02-17 15:11
1***@163.com
太强了
2025-06-16 15:55
6***@qq.com
感谢大佬太强了
2025-10-28 14:51
6***@qq.com
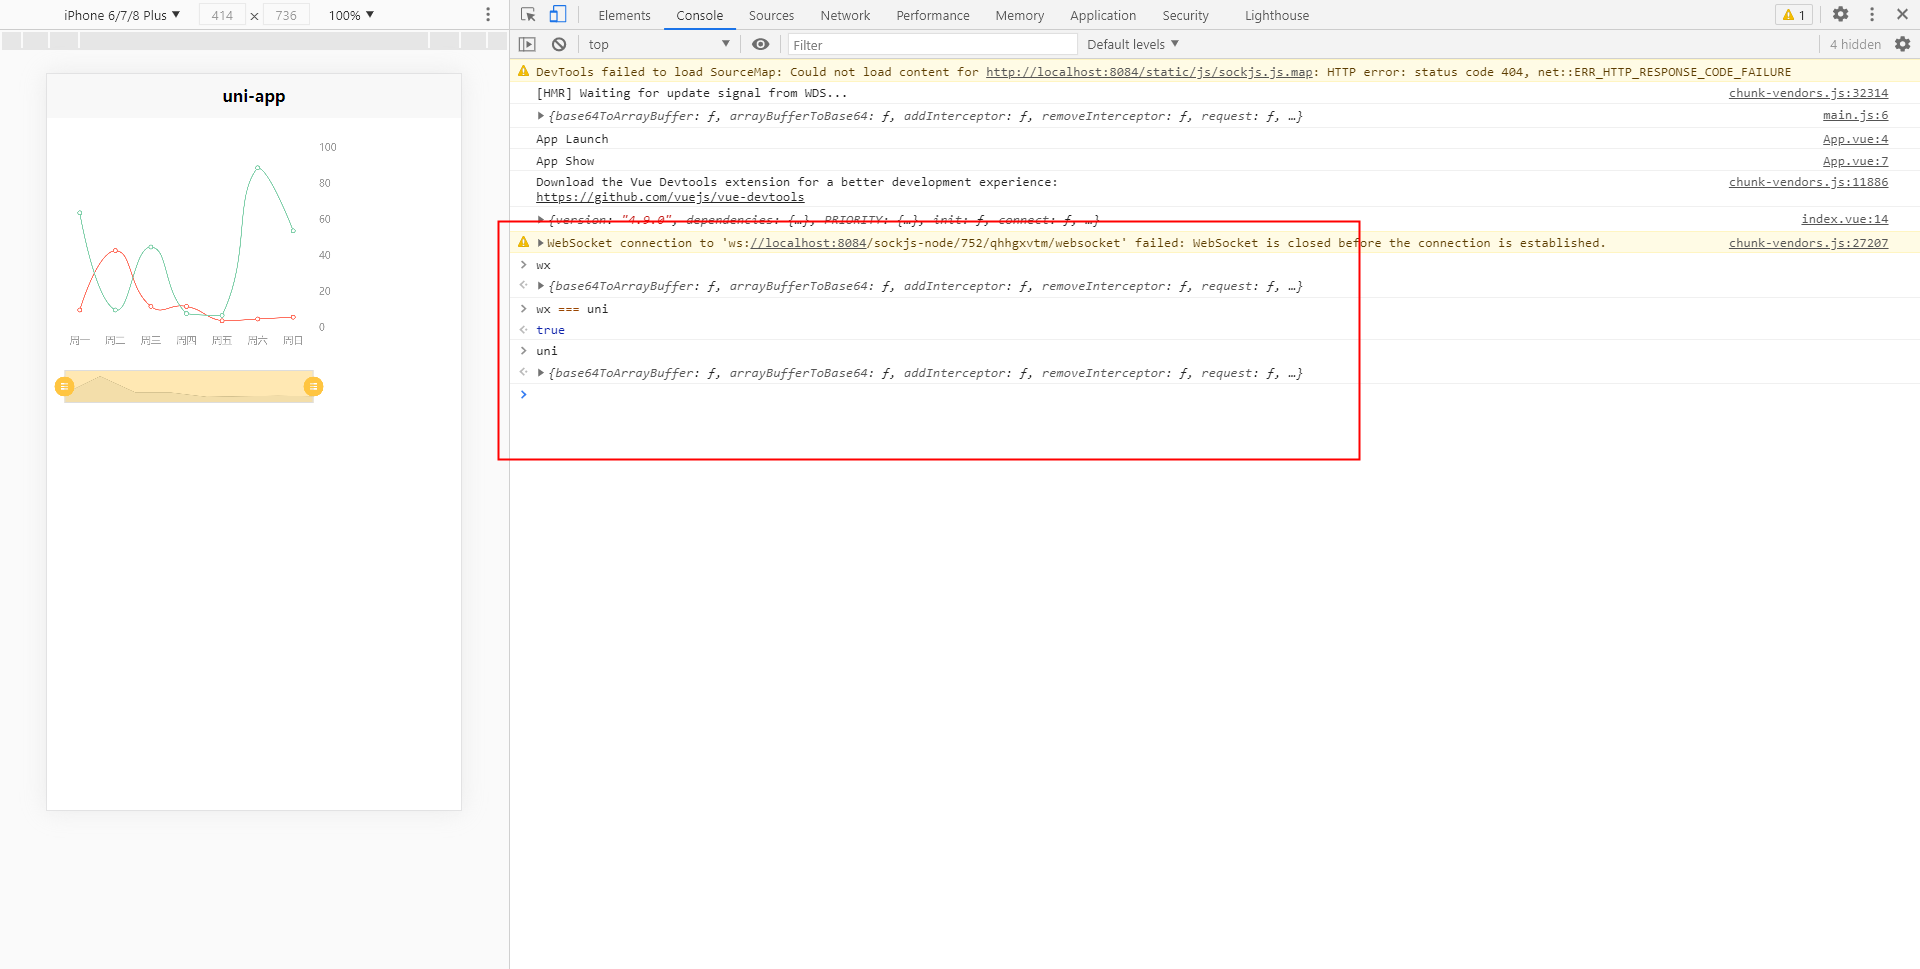
回复 6***@qq.com: window.wx = undefined;//本地和打包后均正常 window.wx = {};//本地正常打包后不正常
2025-10-29 10:04